Counting every token: reading LM Studio's server logs
When you pay for a cloud model, you get a usage dashboard whether you want one or not. When the model runs on your own PC, you get nothing. I wanted the same view for my local models: how many tokens they're chewing through, how fast, and which model is doing the work.
LM Studio already has the numbers. They're just buried in its server logs.
Where LM Studio keeps its logs
The usual place is:
%USERPROFILE%\.lmstudio\server-logs
But some setups write to a folder under apps instead, for example:
%USERPROFILE%\.lmstudio\apps\bionic\server-logs
A single PC can have both. If you only read one, your totals quietly come up short. So the first rule was: find every server-logs folder and read each one separately.
What's actually in a log
After every request, LM Studio's server writes a timing block. It looks like this:
slot print_timing: id 0 | task 0 | prompt eval time = 1000.00 ms / 1000 tokens ( 1.00 ms per token, 1000.00 tokens per second)
slot print_timing: id 0 | task 0 |        eval time = 2000.00 ms /  100 tokens (20.00 ms per token,   50.00 tokens per second)
slot print_timing: id 0 | task 0 |       total time = 3000.00 ms / 1100 tokens
That's everything I need:
- prompt eval — how many prompt tokens were read, and how fast
- eval — how many tokens were generated, and how fast
- the speed lines while it runs (
tg = 50.00 t/s), for a live tokens-per-second number
The core of it is one small pattern that pulls the milliseconds and the token count out of each line:
=\s*([\d.]+)\s*ms\s*/\s*(\d+)\s*tokens
Things that will trip you up
- No timing lines at all? Open a log file and search for
print_timing. If it isn't there, raise the server's log level in LM Studio's server/developer settings. - Only API traffic is logged. These logs cover requests to LM Studio's local server (
http://localhost:1234) from apps, agents and scripts. Chats in LM Studio's own chat window may not show up. - Prompts can contain text that looks like log lines. Logs include the request body, so a prompt can hold something that looks like a log entry. The parser has to tell real log lines from text inside a prompt. That case has its own test.
- Thinking tokens count. Generated tokens include reasoning tokens, so "thinking" models look busier than their visible answers suggest.
- Cancelled requests don't log a timing block, so they aren't counted.
What came out of it: LocalTokens
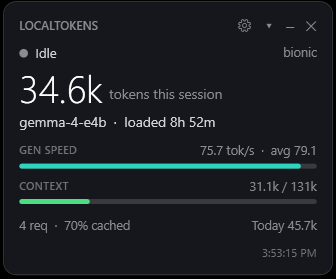
I turned all of this into LocalTokens, a small always-on window and tray icon for Windows. It shows:
- tokens this session, today, this week and all time, per model
- live generation speed, and whether the model is reading a prompt or generating
- context use against the loaded context size
- how much of the prompt LM Studio served from its cache
On first run it reads your old logs too, so your totals start from the oldest log you have, not from the day you installed it.
It's plain PowerShell and WPF, both built into Windows. No Python, no Node, no installer. It only reads LM Studio's log files and asks the local server which models are loaded. Nothing leaves your PC.
Get it here: LocalTokens on GitHub. It's free and MIT-licensed. Grab the zip from Releases, unblock it, and double-click LocalTokens.vbs.
If the numbers look wrong on your setup, open an issue. Odd log folders are exactly the kind of thing I want to hear about.